User Research Reduces Churn
User research-driven product optimization that halved the churn rate.
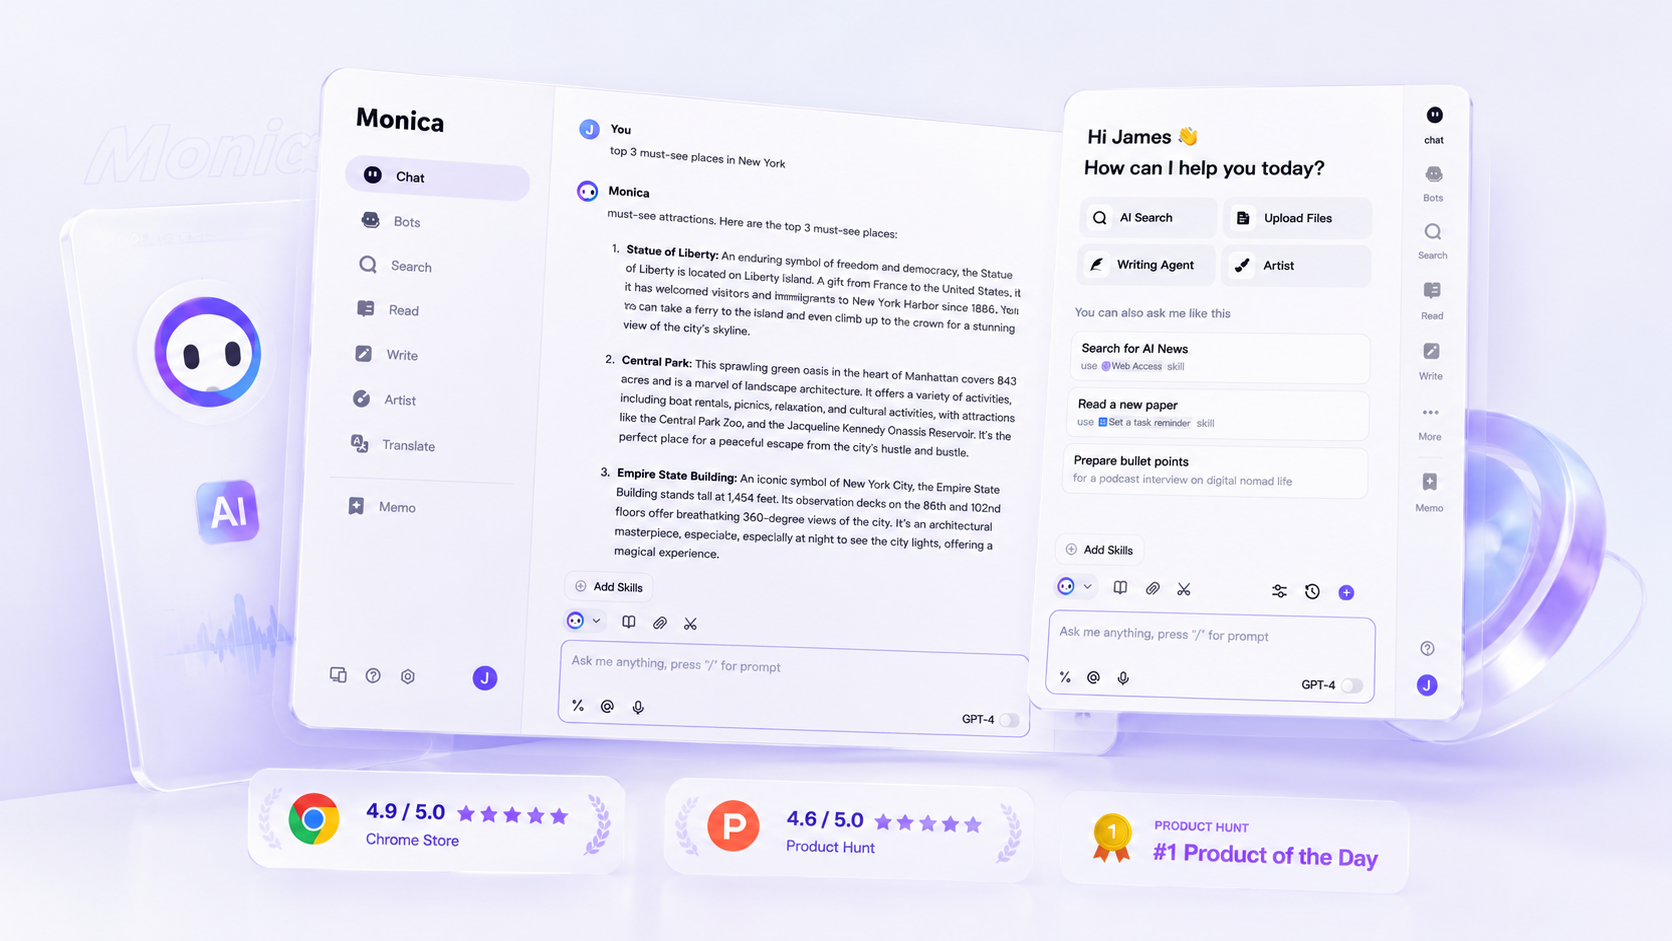
Monica is an AI browser extension for overseas users, embedding ChatGPT-level capabilities directly into the browser — chat, quick actions, reading assistant, ChatPDF, YouTube summary, and more.
The first thing I did at Monica was design the uninstall landing page and cancel subscription popup — two critical valves where users leak out. The fact that the company invested design effort into these two moments of user loss tells you something: losing users means losing revenue. This made me realize Monica deeply cared about user experience, retention, and subscription rates.
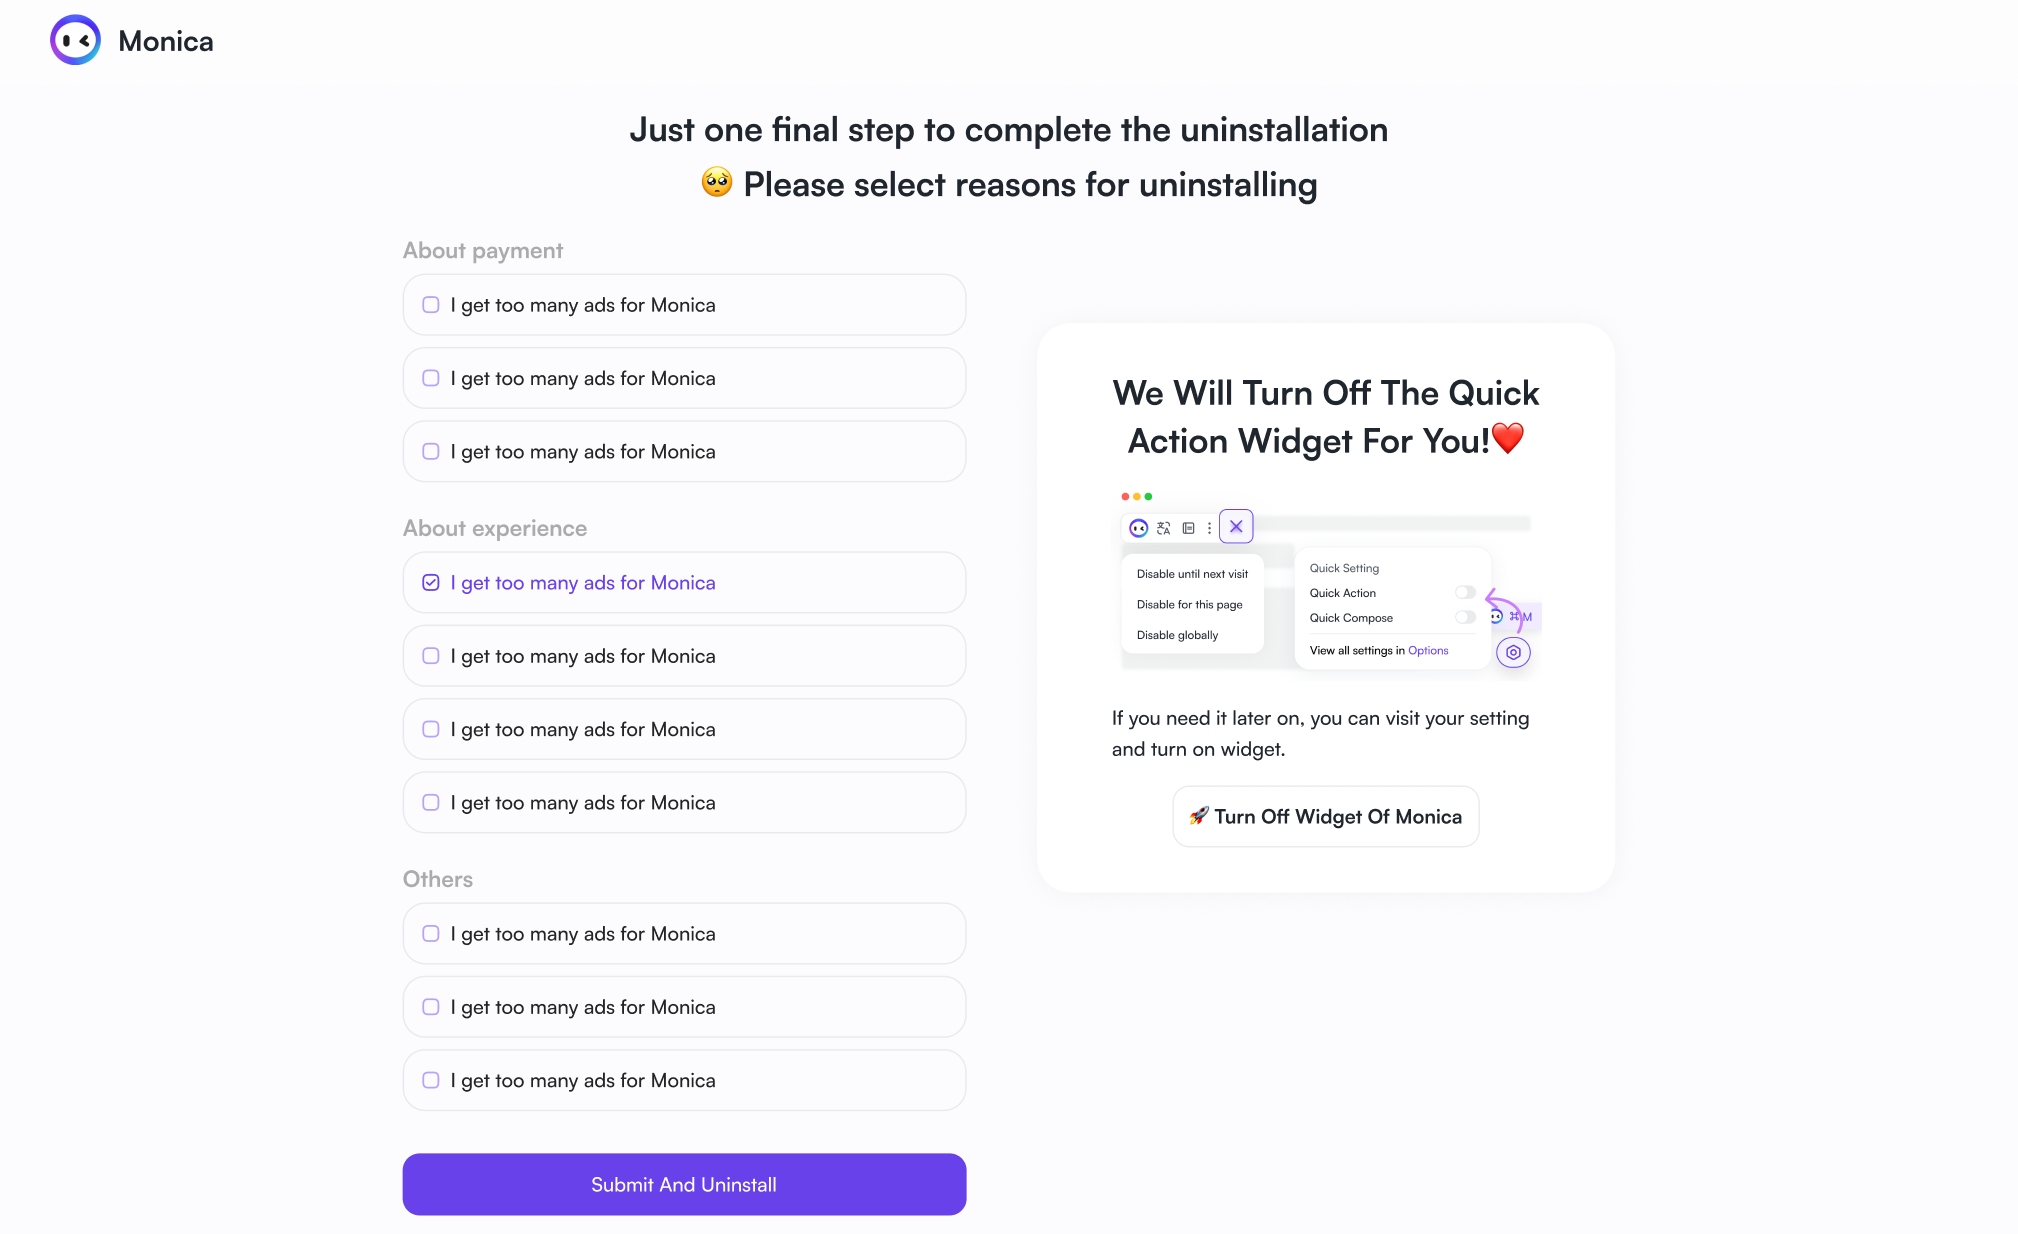
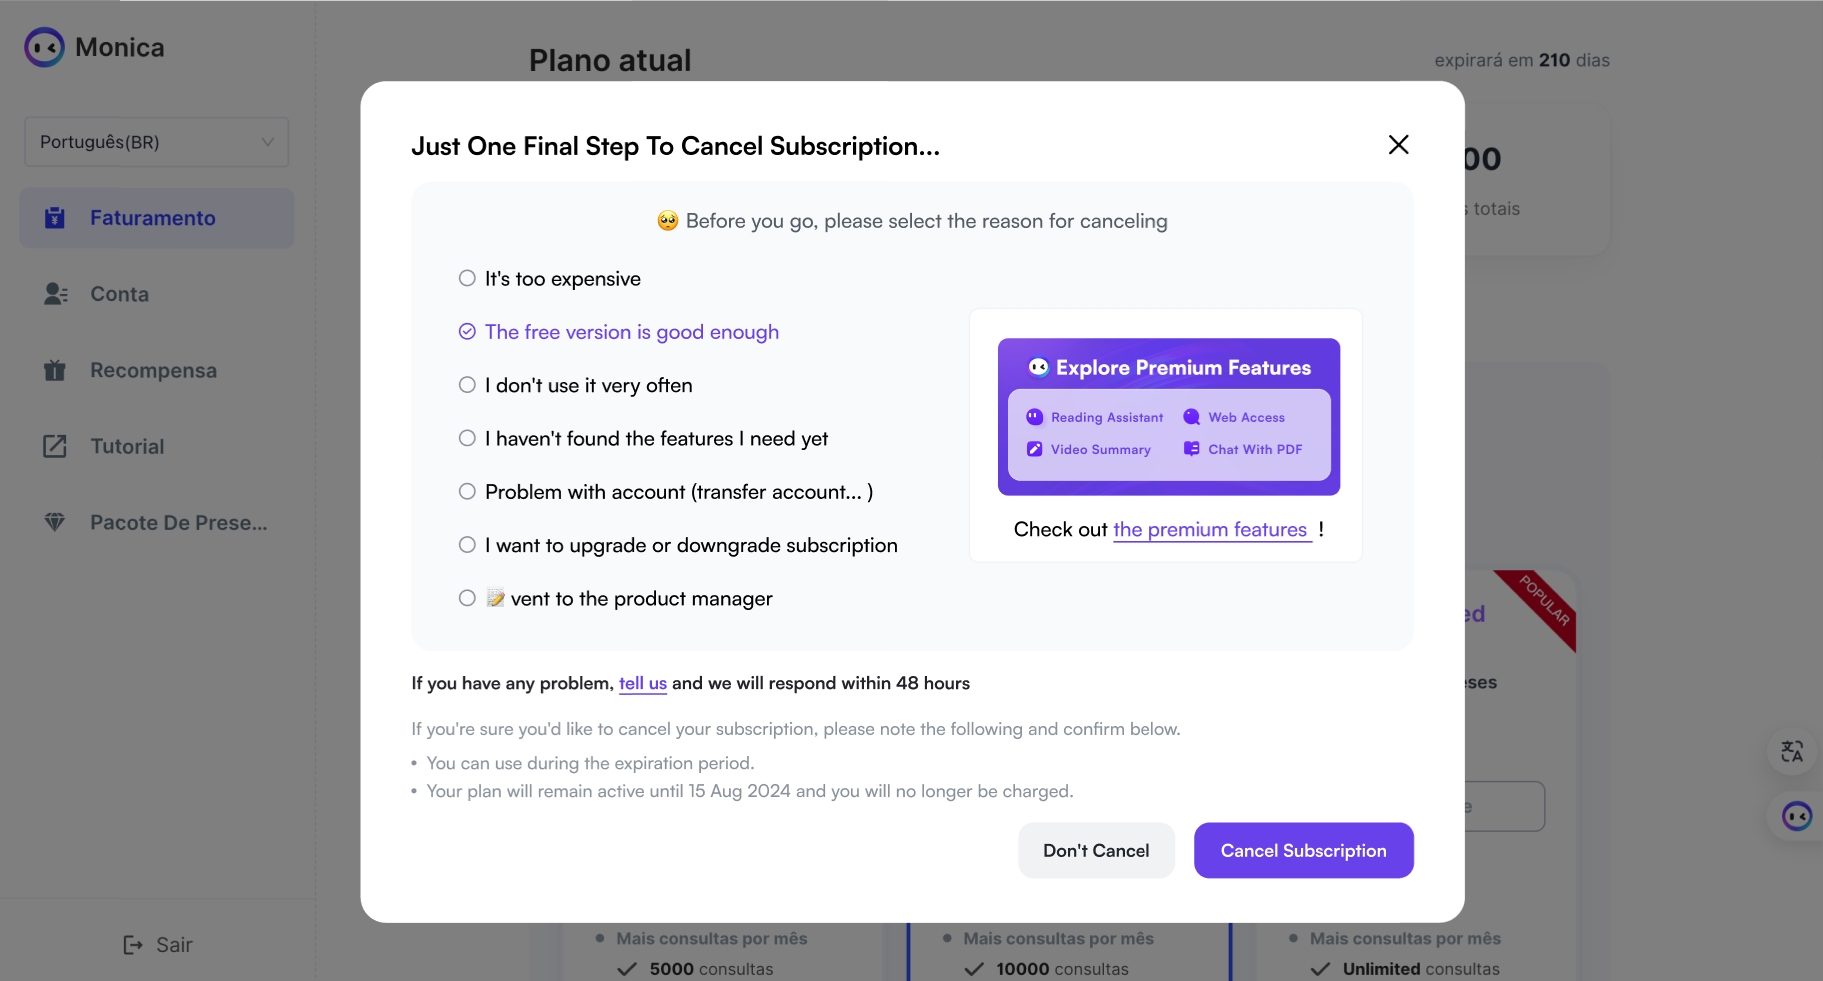
I became curious about user research. The uninstall survey answers were vague — "hard to use," "not free enough," "insufficient quota," "slow performance"… But the most frustrating part was that 17.7% of users only said "don't like it" without explaining why. The feedback page itself wasn't designed to capture actionable insights. I wanted to understand the real reasons users were leaving. So I talked to my mentor and set a goal: improve the product experience from 40 to 60+.
Track 1: What the Emails Told Us
To achieve this goal, I started building a research system. Every day, I filtered through user feedback emails — feature requests, pain points, usage questions. These came from our most engaged overseas users. A clear signal kept emerging: Quick Action (QA) was the source of repeated frustration.
The complaints clustered around a few themes:
"A bit annoying, very intrusive, and doesn't provide useful information." — 60 similar complaints about QA's popup behavior
"After merging all bots together, it's hard to use different ones. I almost never use memo, art, or the translation and writing features." — User requesting rollback to old version
"The keyboard shortcut keeps blocking my content." — QA popup appearing at the wrong time
I also ran an expert walkthrough with the team, systematically auditing QA's UI, interactions, and information design. We identified 10+ issues across two dimensions — user impact and implementation effort — and prioritized them:

We also did competitive analysis — studying how Sider handles voice read-aloud, how Grammarly surfaces formality settings, and how DingTalk uses a fixed input bar to avoid popup interference. The core insight from all three: the best UI is the one users don't notice until they need it.
The expert walkthrough crystallized the user complaints into a clear design problem:
Users' core need: QA should appear automatically when needed, and stay out of the way when not needed.
The solution direction was taking shape — but there was a catch. The email feedback came from our most active power users. Power users don't represent the majority. Their pain points might be real, but they might not be everyone's pain points. We needed a broader view.

Track 2: Random Survey Validates the Hypothesis
So we ran 20,000-question surveys and 11 in-depth interviews with high-frequency users across different countries. This gave us the full picture:
Almost all users only cared about a few features, and most did not even know new features existed.

The data validated what the emails hinted at — and revealed the root cause. QA was the highest-conversion entry point, the gateway through which users discovered other features. But QA was broken in ways that blocked discovery. Users who never found QA's value never explored beyond Chat. That's why memo sat at 2.79% penetration, Write Agent at 1.94%, and artist at 3.54%.
Three user groups, each with different needs:
"I use Monica every day for work emails and document polishing. The sidebar is convenient — I don't need to open a new tab like ChatGPT." — Unpaid user, UX Designer
"40 free queries are enough for me. I'm a student, I can't afford paid plans." — Unpaid user, Student
"I subscribed for YouTube Summary. Before watching a video, I check the summary to see if it's worth my time." — Paid user, AI Engineer, $240K+ income
"I used Monica for my master's thesis — reading 20-60 page papers with ChatPDF. But sometimes the PDF uploads but Monica can't read it." — Paid user, Special Education Teacher
Free users who never explore (7/9 interviewees) only used Chat and Quick Actions, never discovered other features, satisfied with the basics, no motivation to upgrade. Non-native English speakers (9/11 interviewees) primarily used Monica to polish emails and documents — a workflow we had never specifically optimized. Students needing academic tools (3/9 interviewees) needed to read papers, compare multiple PDFs, preserve images during translation — things ChatPDF previously struggled with.

What We Did
The research converged on one central insight: QA is not just a feature — it's the gateway to all other features. Fix QA, and you fix feature discovery. Fix feature discovery, and you fix retention.
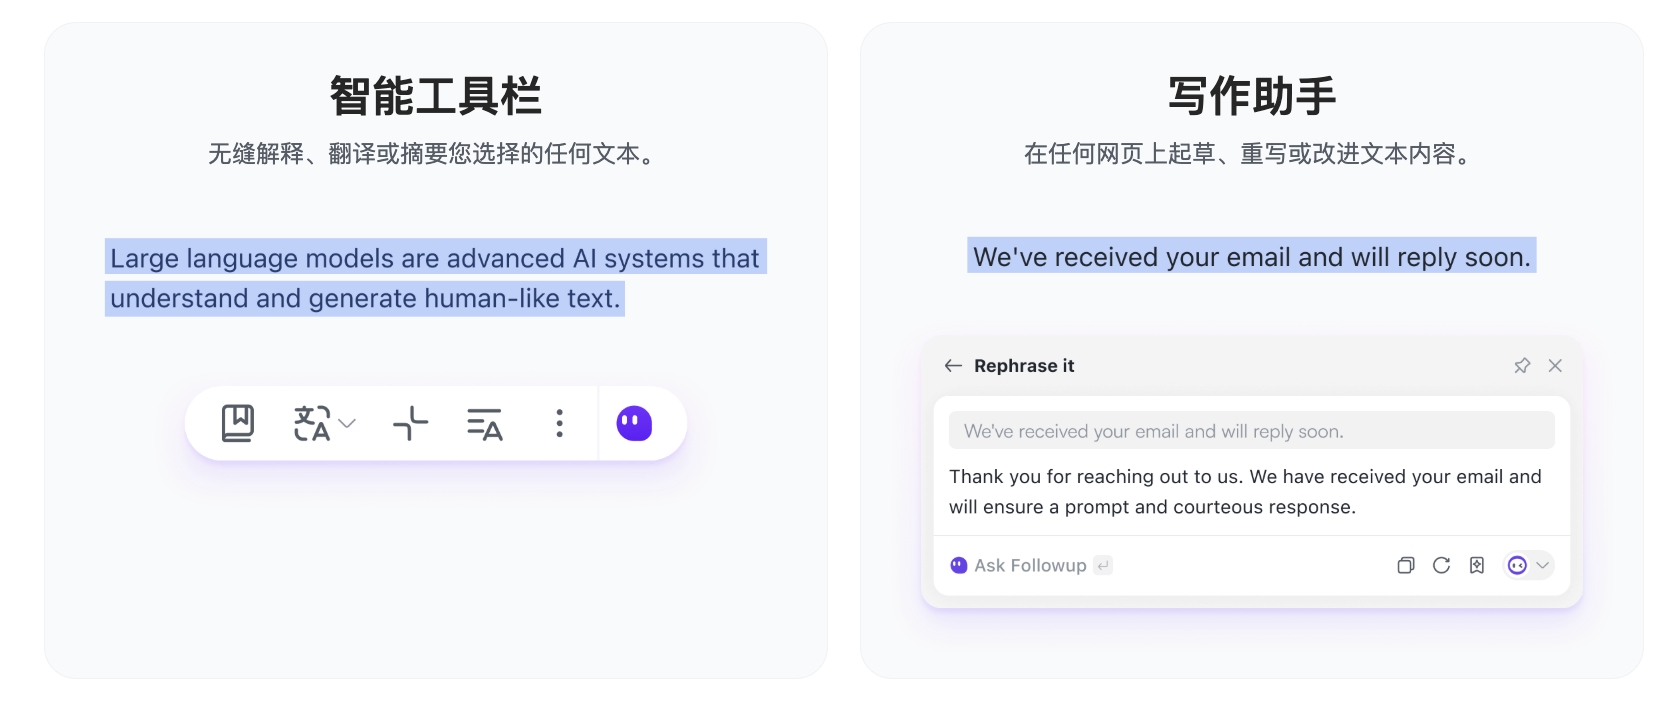
Main thread: QA redesign. We rebuilt the Quick Toolbar to surface high-value features upfront. The popup logic was overhauled — one-click close instead of three options, keyboard shortcut to recall QA after dismissal, and a fixed input bar inspired by DingTalk to reduce visual interference. Instructions could be pinned (up to 6) for quick access.
Along the way, we also fixed other issues the research surfaced: language translation for non-native English speakers, ChatPDF improvements for academic use cases, font size customization, and YouTube summary reliability.
What we chose not to build. Users requested vibe coding, niche language translation, and more. But based on cost, ROI, and engineering bandwidth, we chose not to prioritize them — saying no was as important as saying yes.
Impact
The research-driven redesign moved the needle on feature adoption, retention, and churn.
Feature discovery improved. After optimizing the Quick Toolbar, users started exploring features they previously ignored. Feature penetration data shows the impact — Chat led at 11.22%, followed by Reading (8.31%), Write (7.57%), and Search (7.18%). The Quick Toolbar redesign was the key driver, surfacing high-value features upfront.
Retention went up, churn went down. The combined optimizations led to measurable improvements:
- Uninstall rate: 36.47% → 18.1% (-50%)
- Next-day retention: 7.25% → 9.50% (+31%)